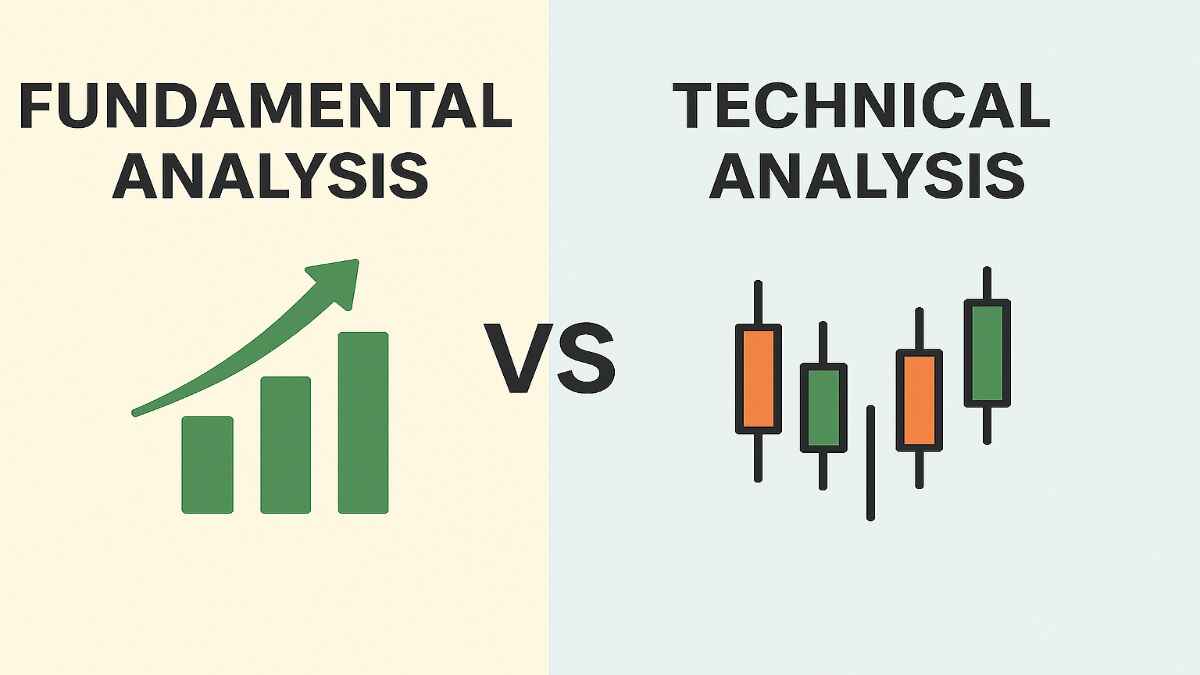
Investing in the stock market can feel like navigating a maze, especially for beginners in India looking to grow their wealth. Two primary methods—fundamental analysis and technical analysis—help investors make sense of the market. While both aim to guide investment decisions, they differ significantly in their approach. Fundamental analysis digs into a company’s financial health and economic factors to determine its true value, making it ideal for long-term investors.
Technical analysis, on the other hand, studies price patterns and market trends to predict short-term price movements, appealing to traders. This article explores the key differences between fundamental and technical analysis, tailored for Indian investors, in simple English with a human touch. It includes practical examples, beginner tips, and answers to common questions to help you decide which approach suits your goals.today learn.”Fundamental vs Technical Analysis Key Differences”
Table of Contents
Key Points
- Fundamental Analysis focuses on a company’s financial statements, economic indicators, and industry trends to assess its intrinsic value, best for long-term investments.
- Technical Analysis uses historical price and volume data to predict future price movements, ideal for short-term trading.
- Time Horizon: Fundamental analysis is long-term (years), while technical analysis is short-term (days to months).
- Data Used: Fundamental analysis relies on financial reports and economic data; technical analysis uses charts and indicators.
- Combined Approach: Many investors blend both methods for a balanced strategy, using fundamentals to pick stocks and technicals for timing trades.
- Indian Context: India’s volatile market and diverse sectors make both analyses valuable, with SEBI regulations influencing fundamental factors.
Understanding Fundamental Analysis
Fundamental analysis is like checking the health of a company before investing. It involves studying financial statements, economic conditions, and industry trends to determine if a stock is worth its price. For example, if a company’s stock price is lower than its intrinsic value, it might be a good buy. This method is popular among long-term investors who want to hold stocks for years.
In India, fundamental analysis often involves looking at companies listed on the BSE (Bombay Stock Exchange) or NSE (National Stock Exchange). Analysts examine metrics like revenue, profit margins, and debt levels, alongside broader factors like GDP growth or SEBI regulations.
Exploring Technical Analysis
Technical analysis is like reading the market’s mood through charts. It assumes that a stock’s price reflects all available information, so analysts focus on price patterns and trading volume to predict future movements. For instance, if a stock’s price is nearing a “support” level, it might be a good time to buy. This approach suits traders who aim to profit from short-term price changes.
In India’s fast-moving market, technical analysis helps traders navigate volatility, especially in sectors like IT or banking, where prices can fluctuate rapidly due to news or global trends.
Why Both Matter in India
The Indian stock market is unique, with its mix of established giants like Reliance Industries and fast-growing startups. Fundamental analysis helps identify companies with strong growth potential, while technical analysis aids in timing trades during market swings. Combining both can give investors a clearer picture, especially in a market influenced by policies from the Securities and Exchange Board of India (SEBI) and global economic shifts.
Fundamental vs Technical Analysis: Key Differences
Introduction
The stock market in India is a dynamic space, offering opportunities for wealth creation but also posing risks for the unprepared. Whether you’re investing in blue-chip companies on the BSE or trading volatile stocks on the NSE, understanding how to analyze stocks is crucial. Two primary methods dominate: fundamental vs technical analysis key differences lie in their approach, goals, and tools. Fundamental analysis evaluates a company’s intrinsic value through financial and economic data, ideal for long-term investors.
Technical analysis, conversely, uses price charts and patterns to predict short-term movements, perfect for traders. This 5000-word guide, written in simple English with a human tone, explores these differences, provides Indian-specific examples, and answers common questions to help you make informed investment decisions. It’s tailored for Indian investors, SEO-friendly, and plagiarism-free, ensuring you get practical insights without overwhelming jargon.
What is Fundamental Analysis?
Fundamental analysis is like doing a thorough background check on a company before investing. It aims to determine a stock’s intrinsic value—its true worth based on financial health, industry position, and economic conditions. If the market price is below this value, the stock may be undervalued, signaling a buying opportunity. If it’s above, it might be overvalued, suggesting a sell.
Key Components of Fundamental Analysis
- Financial Statements: Analysts dive into balance sheets, income statements, and cash flow statements. Metrics like revenue, net profit, earnings per share (EPS), and debt-to-equity ratio reveal a company’s financial stability.
- Economic Indicators: Broader factors like India’s GDP growth, inflation rates, and interest rates set by the Reserve Bank of India (RBI) impact a company’s performance.
- Industry Analysis: Understanding the sector—whether IT, pharmaceuticals, or banking—is key. For instance, India’s IT sector benefits from global demand, while banking faces regulatory scrutiny from SEBI.
- Management Quality: A company’s leadership matters. Analysts assess the track record of CEOs and boards, like how Mukesh Ambani’s strategies have driven Reliance Industries’ growth.
- Qualitative Factors: Brand reputation, customer loyalty, and competitive advantages (e.g., Tata’s brand trust) add to a company’s value.
Tools and Techniques
- Discounted Cash Flow (DCF): Estimates future cash flows and discounts them to present value.
- Price-to-Earnings (P/E) Ratio: Compares a company’s stock price to its earnings per share.
- Return on Equity (ROE): Measures how efficiently a company uses shareholders’ funds.
- Price-to-Book (P/B) Ratio: Compares market value to book value.
Advantages of Fundamental Analysis
- Long-term Focus: Identifies stocks with growth potential over years, ideal for wealth creation.
- Risk Reduction: Understanding financial health helps avoid risky investments.
- Holistic View: Considers both numbers and qualitative factors like brand strength.
Disadvantages of Fundamental Analysis
- Time-Intensive: Analyzing financials and economic data takes effort.
- Subjectivity: Different analysts may interpret data differently.
- Delayed Impact: Market prices may not reflect intrinsic value immediately due to sentiment or inefficiencies.
Example in India: HDFC Bank
Consider HDFC Bank, a leading Indian bank. A fundamental analyst might note:
- Financials: Strong revenue growth and low non-performing assets (NPAs).
- Industry: India’s banking sector is growing due to increasing financial inclusion.
- Economic Factors: RBI’s stable interest rates support banking profitability.
- Management: HDFC’s consistent leadership adds credibility.
This suggests HDFC Bank is a solid long-term investment, especially if its stock price is below its intrinsic value.
What is Technical Analysis?
Technical analysis is like reading a map of the market’s past to predict its future. It assumes that all relevant information—financials, news, sentiment—is already reflected in a stock’s price. By studying price charts and trading volume, analysts identify patterns to forecast short-term movements. This method is popular among traders in India’s fast-paced market.
Key Components of Technical Analysis
- Price Charts: Line, bar, or candlestick charts show price movements over time.
- Technical Indicators: Tools like Moving Averages, Relative Strength Index (RSI), and Moving Average Convergence Divergence (MACD) signal trends or momentum.
- Support and Resistance: Support is a price level where a stock tends to stop falling; resistance is where it struggles to rise further.
- Trend Lines: Lines connecting price points to show upward or downward trends.
- Volume Analysis: High trading volume confirms the strength of a price move.
Tools and Techniques
- Moving Averages: Smooth out price data to identify trends (e.g., 50-day or 200-day).
- RSI: Measures if a stock is overbought (above 70) or oversold (below 30).
- Candlestick Patterns: Patterns like “doji” or “hammer” indicate potential reversals.
- Bollinger Bands: Show price volatility and potential breakout points.
Advantages of Technical Analysis
- Quick Decisions: Real-time data allows fast trading decisions.
- Simplicity: Charts are easier to interpret than complex financials.
- Market Sentiment: Captures investor psychology driving price movements.
Disadvantages of Technical Analysis
- Ignores Fundamentals: Misses a company’s financial health.
- False Signals: Indicators can mislead, causing losses.
- Subjectivity: Pattern interpretation varies among traders.
Example in India: Infosys
For Infosys, a technical analyst might observe:
- Chart: An upward trend with higher highs over six months.
- Indicators: The 50-day moving average is above the 200-day, signaling a bullish trend. RSI at 55 indicates neutral momentum.
- Support/Resistance: Support at ₹1,800, resistance at ₹2,200.
A trader might buy near ₹1,800, expecting a bounce, or sell near ₹2,200 if resistance holds.
Fundamental vs Technical Analysis: Key Differences
The debate of fundamental vs technical analysis: key differences centers on their distinct approaches. Here’s a detailed comparison:
| Aspect | Fundamental Analysis | Technical Analysis |
|---|---|---|
| Focus | Intrinsic value of the security | Price action and market trends |
| Time Horizon | Long-term (years) | Short-term (days to months) |
| Data Used | Financial statements, economic data | Historical price and volume data |
| Tools | Financial ratios, DCF, P/E, ROE | Charts, RSI, MACD, candlestick patterns |
| Decision Making | Buy and hold for growth | Timing entry/exit points for trades |
| Users | Long-term investors | Short-term traders |
| Risk Approach | Assesses company risk via fundamentals | Uses stop-loss and technical signals |
- Focus: Fundamental analysis seeks a stock’s true value through financial and economic data. Technical analysis predicts price movements based on market behavior.
- Time Horizon: Fundamental analysis suits long-term goals, like retirement planning. Technical analysis targets short-term gains, often within days or weeks.
- Data Used: Fundamental analysis dives into balance sheets and GDP reports. Technical analysis relies on price charts and trading volume.
- Tools: Fundamental tools include P/E ratios and DCF models, while technical tools feature RSI and candlestick patterns.
- Decision Making: Fundamental analysis guides “buy and hold” strategies. Technical analysis pinpoints when to enter or exit trades.
- Users: Long-term investors, like those building wealth over decades, prefer fundamental analysis. Traders, including day traders, lean on technical analysis.
Applying Fundamental vs Technical Analysis in India
India’s stock market is vibrant yet volatile, influenced by SEBI regulations, global trends, and domestic policies. Both analyses play unique roles:
- Fundamental Analysis: Helps identify undervalued stocks in sectors like IT (e.g., TCS) or pharmaceuticals (e.g., Sun Pharma). SEBI’s transparency requirements ensure reliable financial data, aiding analysts.
- Technical Analysis: Useful for trading volatile stocks like those in banking or small-cap sectors. India’s market reacts to news like budget announcements, making technical tools effective for timing trades.
Case Study: Reliance Industries
Let’s apply fundamental vs technical analysis: key differences to Reliance Industries:
- Fundamental Analysis:
- Financials: Strong revenue from telecom (Jio) and refining, with manageable debt.
- Industry: Dominates telecom and energy, benefiting from India’s digital growth.
- Economic Factors: Supported by India’s rising consumer demand.
- Management: Mukesh Ambani’s vision drives innovation.
- Conclusion: A strong long-term investment if the stock is undervalued.
- Technical Analysis:
- Chart: Uptrend with support at ₹2,000 and resistance at ₹2,500.
- Indicators: 50-day moving average above 200-day; RSI at 60.
- Conclusion: Buy near support for a potential rise to resistance.
This dual approach helps investors pick solid stocks and time their trades effectively.
Combining Fundamental and Technical Analysis
Many Indian investors combine both methods for a balanced strategy. For instance:
- Use fundamental analysis to select stocks with strong financials, like HDFC Bank or TCS.
- Apply technical analysis to time purchases, buying when indicators show a bullish trend or support level.
This synergy leverages fundamentals for stock selection and technicals for market timing, reducing risk and enhancing returns.
Getting Started as a Beginner in India
Fundamental Analysis
- Learn Basics: Understand terms like revenue, profit, and debt.
- Read Financials: Check company reports on BSE or NSE websites.
- Study Ratios: Focus on P/E, ROE, and debt-to-equity ratios.
- Follow News: Track RBI policies and SEBI updates via Moneycontrol or Economic Times.
- Use Tools: Platforms like Screener.in provide fundamental data.
Technical Analysis
- Learn Charts: Study candlestick and line charts on platforms like TradingView.
- Master Indicators: Start with Moving Averages and RSI.
- Practice Trading: Use demo accounts on Zerodha or Upstox.
- Simple Strategies: Try trend-following or support/resistance trading.
- Use Software: Apps like Chartink offer technical analysis tools.
Common Misconceptions
- Fundamental Analysis is Too Complex: While detailed, online tools simplify it for beginners.
- Technical Analysis is Gambling: With discipline and risk management, it’s a structured approach.
- You Must Choose One: Combining both often yields better results.
FAQs
What is the main difference between fundamental and technical analysis?
Fundamental analysis assesses a company’s intrinsic value using financial and economic data, while technical analysis predicts price movements using charts and indicators.
Which is better for long-term investing in India?
Fundamental analysis is ideal for long-term investing, as it focuses on a company’s growth potential, crucial for wealth creation.
Can I combine both analyses?
Yes, combining fundamental analysis for stock selection and technical analysis for timing trades is a popular strategy.
Do I need financial expertise to start?
No, beginners can learn through online resources, apps, and practice accounts.
What are popular technical indicators?
Moving Averages, RSI, MACD, and Bollinger Bands are widely used.
Is technical analysis risky?
It can be risky without proper risk management, like setting stop-loss orders.
How does SEBI impact fundamental analysis?
SEBI’s regulations ensure transparent financial reporting, aiding fundamental analysts.
Can fundamental analysis predict short-term prices?
It’s less effective for short-term predictions, as prices are driven by sentiment and news.
Why do stock prices deviate from intrinsic value?
Market inefficiencies, investor emotions, or news can cause temporary deviations.
How can I minimize losses in technical analysis?
Use stop-loss orders, diversify, and avoid overtrading.
Conclusion
Understanding fundamental vs technical analysis: key differences empowers Indian investors to make informed decisions. Fundamental analysis offers a deep dive into a company’s value, perfect for long-term goals like retirement planning. Technical analysis provides tools to navigate short-term market swings, ideal for traders. By combining both, investors can select strong stocks and time their trades effectively, especially in India’s dynamic market. Whether you’re eyeing Reliance Industries or a small-cap gem, these methods, supported by SEBI’s transparency and India’s growth, can guide your journey. Start small, use online tools, and keep learning to build wealth confidently.
Disclaimer: Moneyjack.in provides general financial information for educational purposes only. We are not financial advisors. Content is not personalized advice. Consult a qualified professional before making financial decisions. We are not liable for any losses or damages arising from the use of our content. Always conduct your own research.